

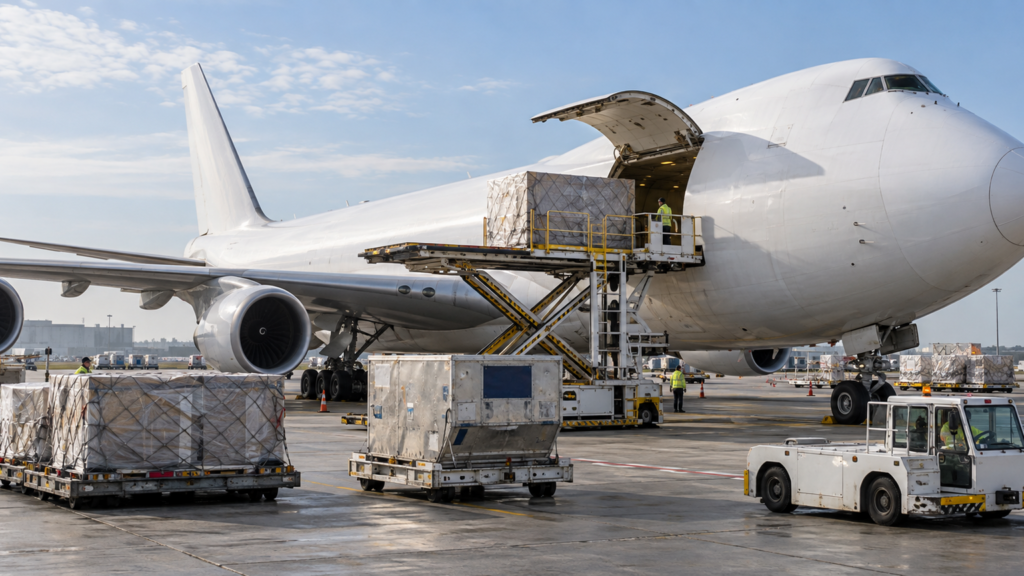
Global air cargo demand rose 4.4% year on year in August, according to IATA. International traffic increased 5.3%, while available capacity slipped 0.1%. The global cargo load factor rose two percentage points to 46%.
That is normally a favourable setup for pricing: demand is expanding faster than supply. Cargo yields increased from the previous month for the first time since April.
But the same month also showed why stronger demand does not automatically translate into stronger margins. Jet fuel was 8.3% more expensive than in July and 79.2% more expensive than a year earlier. At the same time, traffic growth diverged sharply by corridor.
For a carrier, the outcome now depends less on the global headline and more on the economics of each route: outbound and return loads, fuel burn, detours, airport access and the speed at which higher costs can be passed on to customers.
Electronics are supporting time-sensitive demand
Air freight makes economic sense when the cost of delay exceeds the premium for faster transport. That applies to semiconductors, servers, network equipment, pharmaceuticals and urgent industrial components.
The investment cycle around artificial intelligence has added demand for exactly this type of cargo. Computing equipment is valuable relative to its weight, and delays can postpone data-centre deployment or production schedules.
The WTO’s September Goods Trade Barometer points in the same direction. Its electronic-components index reached 104.9 and its air-freight index stood at 102.8, both above the 100 trend baseline. The container-shipping component was below trend at 99.6.
Those indicators do not prove that electronics alone are driving air cargo growth. They do show that the current mix of trade includes categories for which speed has unusually high economic value.
Route performance is diverging
Traffic between Asia and North America increased 13.2% year on year in August. Within Asia, traffic rose 6.1%, while Europe-Asia expanded 3.1%.
Gulf-connected lanes moved in the opposite direction. Europe-Middle East traffic declined 12.1%, while Middle East-Asia fell 11%. IATA links the weakness to continuing military and operational disruption in the region.
For cargo airlines, an airspace closure affects much more than flight time. Rerouting aircraft can break crew and aircraft rotations, increase fuel consumption and reduce the number of sectors the same fleet can operate. Airlines also need more schedule buffer to absorb further disruption.
Some traffic can shift to direct Europe-Asia services or alternative hubs. Demand on those routes may rise, but the available aircraft fleet does not expand with it. The advantage goes to airlines that already have suitable wide-body capacity, traffic rights and airport slots.
A fast-growing route can still produce a weak margin if detours, ground handling and an underfilled return leg absorb the additional revenue.
Jet fuel is creating a separate cost shock
Airlines are not only paying more for crude oil. They are also paying a much larger premium for finished jet fuel.
IATA expects jet fuel to average about $152 a barrel in 2026, up from $90 in 2025. The spread between jet fuel and Brent crude — the crack spread — is forecast to average about $57 a barrel, an historic high.
That creates a hedging mismatch. The industry has hedged roughly one-third of expected 2026 fuel consumption, but many contracts protect the crude-oil component because that market is deeper. A carrier can therefore be protected against a rise in Brent and remain exposed to a surge in the refinery premium for jet fuel.
Fuel is expected to account for 31.4% of airline operating expenses in 2026, up from 25.4% in 2025. Cargo rates can recover some of that increase, but only with a lag. Contract pricing, pre-booked capacity and competition slow the pass-through.
Return loads matter as well. A fully loaded outbound aircraft and a lightly loaded return flight have to recover the cost of the entire rotation from fewer paid tonne-kilometres.
Airlines cannot add capacity quickly
High yields would normally attract more supply, but aviation capacity cannot be expanded in a matter of weeks.
The global aircraft backlog reached 18,100 units in May 2026, more than half the active fleet. Wide-body deliveries remain constrained, while passenger aircraft are staying in service for longer instead of being released for freighter conversion.
Cargo aircraft were already 19.6 years old on average in 2025. Older aircraft generally require more maintenance and consume more fuel just as both inputs become more expensive.
A substantial share of air cargo also travels in the belly holds of passenger flights. Cargo capacity therefore depends on passenger schedules. When a flight is cancelled or rerouted, the cargo space attached to that service disappears as well.
The 0.1% decline in August capacity is small in isolation. Its significance is that the market is entering peak season with limited ability to add efficient aircraft quickly.
Shippers need to compare total cost, not just freight rates
For manufacturers, the decision between air and ocean freight is not simply a comparison of transport prices. It also includes inventory carrying costs, the risk of a production stoppage, product life, working capital and route reliability.
A critical component can justify an expensive flight if it prevents a factory shutdown. A lower-value product may respond to the same fuel shock by moving to sea, increasing inventory or relocating part of the supply chain.
Route resilience is also becoming part of procurement. A familiar hub may be cheaper in normal conditions but vulnerable to airspace closures. A more expensive direct service can be rational if it reduces delay risk and avoids an additional transfer.
Carriers face the reverse calculation. Scarce aircraft need to be assigned to routes where yield, load factor, return cargo and operational reliability cover fuel and disruption costs.